The World Data Center of Geoinformatics and Sustainable Development (WDC-Ukraine) at Igor Sikorsky Kyiv Polytechnic Institute specializes in providing interdisciplinary research of complex systems of different nature. WDC-Ukraine activities include decision-making support for long-term issues of social development in terms of its sustainability. The Center also provides informational support for estimations of sustainable development perspectives and implementation of sustainable development concepts in higher education, business, and politics.
At the World Data Center Lab
The Joint Training and Research Big Data Intelligence for Cyber-physical Systems Laboratory of the Institute of Physics and Technology and the World Data Center for Geoinformatics and Sustainable Development of Igor Sikorsky Kyiv Polytechnic Institute was established in 2020. A well-known scientist in information retrieval, artificial intelligence, information security, Doctor of Technical Sciences, Professor Dmitry V. Lande headed the laboratory. Director of the Institute of Physics and Technology, Doctor of Technical Sciences, Professor Oleksii Novikov was appointed Scientific Advisor of the Laboratory of Big Data analysis in cyber-physical systems. Specialists from the World Data Center, the Institute of Physics and Technology, the Institute of Specialized Communication and Information Security, and other structural subdivisions of Igor Sikorsky Kyiv Polytechnic Institute are solving the tasks of the laboratory.
The first task of the laboratory was to create a subsystem for collecting and analyzing data from social networks to further assess the level of public support for processes and events reflecting in the virtual network environment. This subsystem is a part of the integrated online platform Advanced Analytics of the World Data Center Geoinformatics and Sustainable Development. The Advanced Analytics platform is a hardware-software complex designed to develop, deploy and operate web services tools and specialized web applications for intelligent analysis of structured data and contextually dependent data (unstructured data). The platform also aims to assess the situation in making managerial decisions in the economy, public relations, national security of Ukraine.
Laboratory experts have also created software tools for the analytical processing of information from social media. The tools analyze the tone of individual messages, the dynamics of thematic information flows. Besides, they allow forming models of subject areas, networks of terms, persons, sources of information. The social networks subsystem works as part of geoinformation support. All software components of the subsystem are basing on free software. With modern application software interfaces, the subsystem is integrated with the online platform Advanced Analytics.
‘The Lab is planning to develop this subsystem,’ said its Head Professor Dmitry Lande, 'connect new components, work closely with the information systems of the World Data Center, its implementation in the educational process.’ Numerous meetings, presentations in the Information and Analytical Situation Center of the University prove that the integrated online platform is significant. Moreover, our country authorities are also interested in the subsystem of data collection and analysis from social networks.
Monitoring of surface water dynamics in Crimea
‘Today, data on the Crimea water resources are important both from the point of view of the quality of life analysis of Ukrainian citizens in the temporarily occupied territory and from the point of view of national security,’ said Director of the WDC-Ukraine Kostiantyn Yefremov. Indeed, the Crimean peninsula is unsupplied with water resources. The precipitation is low for various types of farming in most of the territory of Crimea. That is why in the 1960s, the construction of the North Crimean Canal started. Its waters provided up to 85% of the needs of Crimean residents in freshwater. However, since 2014 the canal has been blocked, which leads to some new geo-ecological processes that need to be studied.
Currently, Crimean residents receive water from reservoirs fed from local sewage and underground wells. ‘Based on remote sensing data and modern geoinformation technologies, an analytical panel (dashboard) was developed. It aims for analyzing and monitoring the surface water dynamics of Crimean reservoirs,’ says Deputy Director, Head of the Laboratory for econometrics and forecasting Ivan Pyshnograiev. The dashboard panel can search by address, choose space maps, topographic maps as basic maps, calculate areas, lengths, filter objects by territorial affiliation, and carry out the comparative analysis of separate reservoirs’.
Data from the Global Land Analysis and Discovery (GLAD) laboratory in the Department of Geographical Sciences at the University of Maryland were used to design analytical dashboards for monitoring the dynamics of the surface water of the Crimea. The GLAD data include an analysis of a series of space images of the Landsat 5, 7, 8 mission from 1999 to 2020, and data from the European Copernicus observation programme. Data processing takes place in the environment of geographic information systems (GIS). It allows you to select the selected area, filter out unnecessary objects for analysis, and conduct spatial and temporal studies, and more.
‘The obtained series of raster layers groups by periods, classified and combined with other geospatial data for further analysis,’ says GIS application developer Serhii Gapon, ‘Next, pixels turn into a vector format. It’s when the available attributes, for instance, probability, intensity change, seasonality, recurrence, maximum water level, add attributes of the name of reservoirs, their constant area, volume, etc. These complex layers download in the web environment. Then go formation of web maps, online applications, and analytical dashboards.
Such dashboards have many controls and graphs. These features allow online visualization and analysis of the reservoir area for different years, compare the percentage change in the rate of decrease/increase of reservoir water levels, explore some statistical indicators of selected objects for a specific time, etc. The panel is easy to use and has a precise interface, so the analytical data is quite simple and convenient to demonstrate to professionals and the public.
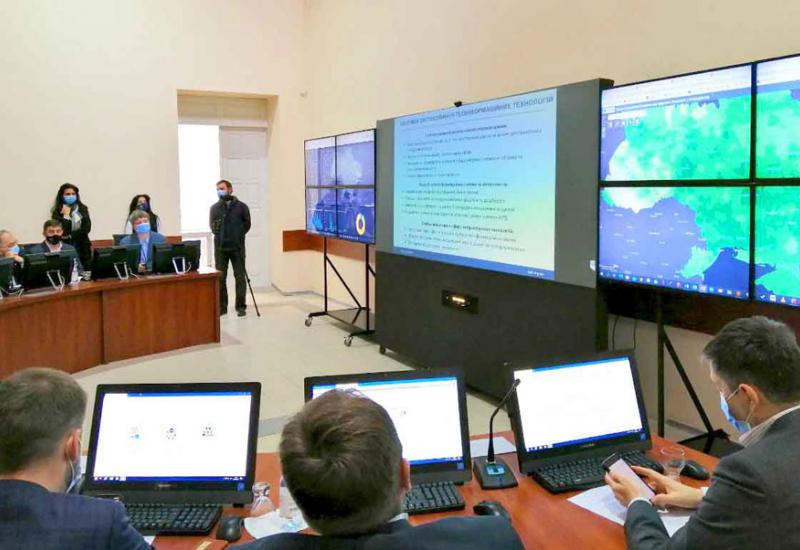
Recently, state authorities of Ukraine and relevant ministries have seen the dashboard features of the subsystem in the Information and Analytical Situation Center of Igor Sikorsky Kyiv Polytechnic Institute. Generally, the subsystem received positive feedback from experts and senior officials.

